Written by David Lareau, IT Service Management expert.
Most business units today rely on IT departments to operate normally, and the stability of IT is essential to keep the business running smoothly. The IT department must provide reliable, consistent, robust and adaptable IT services.
I have summarized here a short list of action points that need to be monitored to ensure continuity
Action points
-
Identify key resources, document their knowledge and plan for redundancy
-
Design a high-level IT services catalog (we must know what we are talking about, what services we offer )
-
Identify all IT infrastructure and services weak spots
-
If there is a recruitment issue in a full employment situation, creativity is needed (optimizing schedules to adapt to peaks, taking on subcontractors for fixed terms, create a talent pool and encourage internal mobility by getting part-time students)
-
In order to prevent labor shortage: retain your current resources by mitigating their frustrations. Make sure you have the right customer facing people. (Ex: developers who have been hired for programming and who are asked to provide direct support to the client may not necessarily be happy in this role). An employee who is not happy in his role may quit or offer lower service quality and performance
-
Having 1on1 addresses dissatisfaction, target employee’s progression and know his/her career goals
-
Support hours/after hours: 24/7: make it profitable according to the number of requests: is it a sinkhole? (Ex: 3 resources working night shifts and charging the company, but not invoiced to the customer)
-
Optimize the monitoring of critical events to alert only when human intervention is required and have an automated escalation. Review each intervention to replace it with automatic solutions (auto-healing) when possible
-
Major incident management process: centralize the list of contacts and prepare communication templates to be used in the event of major incidents. Provide a backup and hard copy in case there is a complete IT System failure
Measure and share key performance indicators that show business continuity :
-
Service availability rate (see below a method to calculate this KPI and the details why this one is important)
-
The number of closed – open incidents (shows the number of interruptions and a capacity issue in the event of a negative imbalance)Average age of tickets and MTTR (When tickets take long to resolve, then users have to sustain interruptions, it has an impact on service continuity)
-
Arising from the previous indicators, the incidents and problems count measured in the backlog may indicate a capacity issue over time. The larger the backlog, the more difficult it will become to prioritize actions. Taken to the extreme, only new and urgent incidents will be addressed. A team dedicated to problem management could be the solution to this issue.
How to calculate the service availability key performance indicator (KPI)
We sometimes hear data centers claiming they offer 99,99% availability on their cloud hosting service. I will explain what exactly this means and how KPI is calculated for an IT service.
Importance of this KPI
The Service Availability Key Performance Indicator shows the basis of your client offering. You might be surprised when calculating your indicator for the first time and you may not want to share it externally too quickly. The only way to improve your availability rate is to start measuring and sharing it with the teams involved. Over time, you will notice improvements in the accuracy of the tickets recorded. The implicated persons will come up with suggestions to avoid further service outages.
Precautions
It isn’t easy to predict or determine which incidents affect the service availability. This is key, because an issue in an underlying item may not necessarily affect the final service. For example, when an incident happens on a server disk drive that has redundancy, it usually has no effect on the final service. This is easy to determine. A not-so-easy to determine example is when you try to measure the service availability of a service that cannot be monitored continuously from start to finish and involves multiple providers (ex: an e-commerce platform availability – the product search display, cart adding, payment processing and order fulfillment). For such a complex workflow, the service availability is calculated using the weakest link method. Each component of the workflow that has an effect on the whole service will be considered in the calculation and the lowest service availability rate will count as the total rate for the service.
Data needed to perform the calculation of the service availability are:
-
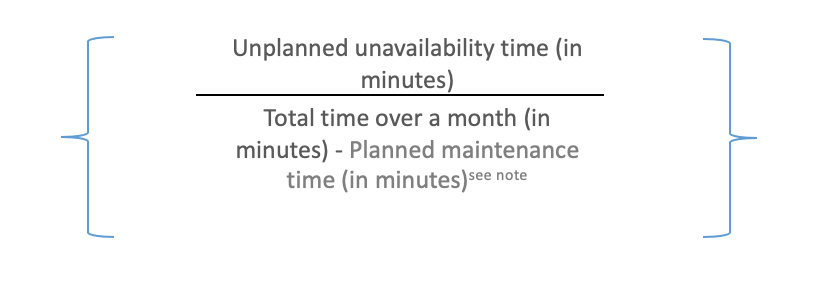
Total time over a month (in minutes)
-
Planned maintenance time (in minutes)
-
Incident related unavailability time (in minutes)
Total time over a month (in minutes)
Explanation:
We need to calculate the total time of minutes per month (Ex: 31 days x 24 hours x 60 min = 44 640 min per month)
Planned maintenance time (in minutes) (optional)
Most of the Service Level Agreements include either a reserved time slot or a minimal notification delay for planned maintenance with a maximum time duration. If your service agreements include such a condition, then you need to exclude the planned maintenance time from the service availability calculation, as I will explain below.
How to find this information
You can find the actual planned maintenance time in your monitoring systems if it keeps monitoring during the maintenance time slots. Although, I would recommend placing your monitoring system in a planned maintenance mode, to prevent it from calculating maintenance as downtime. Then, you may measure the time spent on maintenance within your change management system instead. It is a good practice to have the change plan on hand throughout the whole process and to update the planned timing with actual minutes.
Unplanned unavailability time (in minutes)
How to find this information
Produce a report of major incidents that affected the service (from ticketing system and monitoring systems)
Critical information to measure
Unavailable time, which is the incident duration (Incident resolution time minus incident start time)
Many service desk suites (such as BMC Helix ITSM) automatically calculate the service availability rate by linking incidents to the selected service on the CMDB. You can achieve the same kind of automation with a simple system: think of a way to identify every situation where an incident affects a service availability (a simple checkbox within the ticket). This will allow you to create a monthly report of unavailability time.
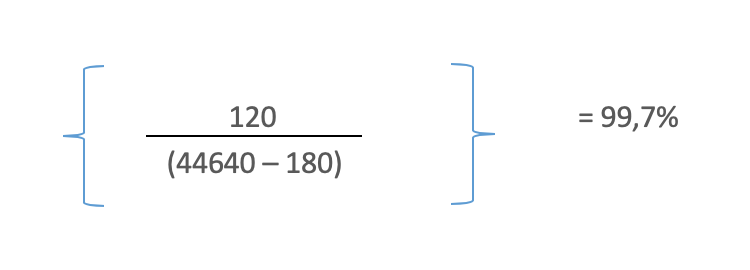
Calculation details :
Ex:
-
120 min of incidents affecting service availability over month
-
A month of 31 days (31 days * 24 h * 60 min) = 44 640 min
-
180 minutes were spent on planned maintenance during the month
Service Availability:
Now that we’ve established the key points that make a strong foundation, I will be preparing my next article about the profitability of an IT department.
By David Lareau